Long-term perspective.

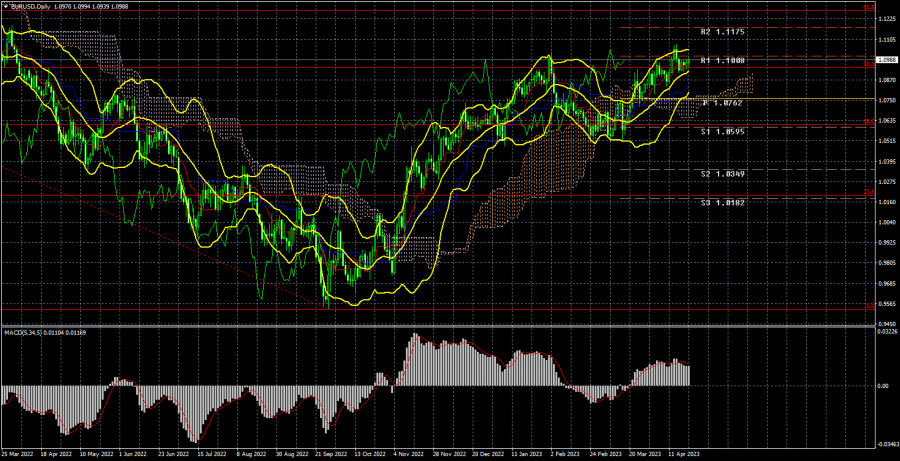
The EUR/USD currency pair again traded somewhat illogically this week. The correction never began, although the pair remained excessively overbought all this time, and its last growth wave was unjustified. Nevertheless, the market still does not consider selling options, so the pair grows or remains very high. From a technical point of view, on the 24-hour TF, the price is above the important 50.0% Fibonacci level, but there is no confidence that growth will continue now. As we already mentioned, the pair is overbought, and the European currency has no growth factors. Of course, the market can buy any pair or instrument without factors; who can forbid it? However, in this case, we can only guess when this movement will end. Or try to anticipate it and its completion using technical analysis.
There were almost no fundamental or macroeconomic events this week. However, all the most important data concerned the British pound, which paid little attention to them. In the European Union, the final inflation figure was published, which did not interest anyone, as the market was already familiar with this report, and the business activity indices did not particularly interest traders. For most of the week, the pair was in a flat state, which is especially visible on the hourly TF. Thus, the technical picture has mostly stayed the same over the past week.
There were also several speeches by representatives of the FRS and ECB, who did not provide any fundamentally new information to the market. Most Fed Reserve representatives adhere to the view that raising the key rate one more time is necessary, while members of the ECB's Monetary Committee are pondering how much to raise the rate in May: by 0.25% or by 0.5%. The rate will increase by 0.25% since inflation in March fell by 1.6% annually. The less "hawkish" the ECB's rhetoric and actions, the more factors for the euro's decline will appear. Although there are enough of them now, the euro refuses to decline.
COT analysis.
On Friday, a new COT report was released for April 18th. Over the past 7-8 months, the data from the COT reports have fully corresponded to what is happening in the market. The illustration above clearly shows that the net position of large players (the second indicator) began growing in September 2022. Around the same time, the European currency began to grow. Currently, the net position of non-commercial traders is "bullish" and remains very high, as do the positions of the European currency, which cannot even properly correct downwards. We have already drawn traders' attention to the fact that a fairly high "net position" value allows us to assume the completion of the upward trend. This is signaled by the first indicator, on which the red and green lines have moved far away from each other, which often precedes the end of the trend. The European currency tried to start falling, but so far, we have only seen a trivial pullback downward. During the last reporting week, the number of buy contracts for the "non-commercial" group decreased by 1.8 thousand, and the number of shorts – decreased by 2.8 thousand. Accordingly, the net position has hardly changed. The number of buy contracts is higher than that of sell contracts for non-commercial traders at 164 thousand. The correction is still brewing, so even without COT reports, it is clear that the pair should start a new decline. But for now, we only see movement to the north.
Fundamental event analysis
In the European Union, as already mentioned, inflation was published. The main indicator has fallen sharply, but core inflation has risen again and is now 5.7% y/y. The core indicator (excluding changes in energy and food prices) has not slowed down even once and is now occupying the minds of ECB representatives. On the one hand, inflation is falling; on the other hand, not quite. The next ECB meeting will show which of these two indicators is more important for the regulator. If the rate of interest rate growth slows down to 0.25%, it means the main; if the rate rises again by 0.5%, it means the core. The manufacturing sector's business activity index has fallen again and is now at 45.5 in April. The service sector's index has risen again and is now at 56.6. As we can see, the economic slowdown and high interest rates primarily affect industry and manufacturing. GDP in the European Union may continue to slow down or even start to decline.
Trading plan for the week of April 24–28:
- In the 24-hour timeframe, the pair has settled back above the Ichimoku indicator lines, but we cannot conclude that the upward trend will continue for a long time. The pair's fall is more likely, but there are currently no sell signals. Therefore, it is now possible to trade on the rise, but it should be understood that the European currency may collapse at any moment. The market situation could be clearer.
- As for selling the euro/dollar pair on the 24-hour TF, it can be considered no earlier than the price being fixed below the critical line. We expect a 50% correction of the entire upward trend, which is in the region of the 1.0300 level. The ECB will not raise rates forever, so market participants maintain high demand for the euro currency.
Explanation of illustrations:
Support and resistance price levels, Fibonacci levels – levels that serve as targets when opening purchases or sales. Take Profit levels can be placed around them.
Ichimoku indicators (standard settings), Bollinger Bands (standard settings), MACD (5, 34, 5).
Indicator 1 on COT charts – the size of the net position for each category of traders.
Indicator 2 on COT charts – the size of the net position for the "non-commercial" group.
Trading analysis offered by RobotFX and Flex EA.
Source


Please do not spam; comments and reviews are verified prior to publishing.