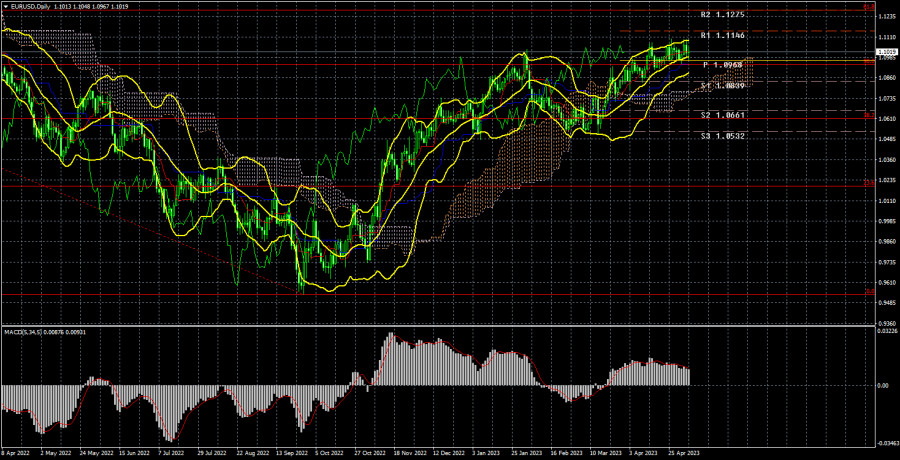
Long-term perspective.

The EUR/USD currency pair traded illogically again this week. This applies to individual macroeconomic events, fundamentals, and everything combined. Throughout the week, various macroeconomic information was published, but traders naturally focused on three or four main events. So: ECB meeting, FED meeting, nonfarm payrolls, and the unemployment rate in the United States.
As expected by the market, the Federal Reserve raised the rate by 0.25%, hinting that this may not be the last tightening of monetary policy. The dollar fell. It can be assumed that the market had already discounted such a decision by the regulator, as it had been known for a long time. However, the next day, the European currency also fell, as the ECB also raised the rate by 0.25% and clarified that it would maintain the monetary policy tightening cycle. Now let's look at the 24-hour timeframe and see that everything has stayed the same over the past week. The euro did not rise or fall but remained in the same place it was a week earlier. Let's assume the market also discounted the ECB rate hike in advance.
The US unemployment rate fell to 3.4% in April, the lowest value in the last 50 years, if not more. The number of nonfarm, despite the fears of traders and experts, amounted to 253 thousand in March, with a forecast of 180–190 thousand. That is, the most important reports of the week were in favor of the dollar and should have provoked its growth, but once again, we did not see any growth. The dollar rose by 70 points during the day and managed to lose them by the end of the day. Some may say that the March Nonfarm value was revised downward, but we believe that this is not the most important point. If you look at the illustration above, there is no single factor in favor of the dollar. But this is not the case.
COT Analysis.
On Friday, a new COT report was released for May 2. Over the past 8–9 months, the data from the COT reports have fully corresponded to what is happening in the market. The illustration above shows that the net position of large players (the second indicator) began to grow in September 2022. At about the same time, the European currency began to grow. Currently, the net position of non-commercial traders is "bullish" and remains very high, as does the position of the European currency, which cannot even correct downwards properly.
We have already drawn traders' attention to the fact that a fairly high net position value allows for the possibility of the uptrend ending soon. The first indicator, which frequently precedes the end of a trend, indicates this when the red and green lines have moved far apart. The European currency tried to start falling, but we only saw a trivial rollback. During the last reporting week, the number of buy contracts for the "non-commercial" group increased by 3.3 thousand, while the number of shorts decreased by 0.7 thousand. Accordingly, the net position grew again by 4 thousand contracts. The number of buy contracts is higher than that of sell contracts among non-commercial traders by 174 thousand, which is a lot. The difference is almost threefold. A correction is still brewing, so even without COT reports, it is clear that the pair should start falling. But for now, we only see movement to the north.
Fundamental event analysis.
As we said above, plenty of macroeconomic and fundamental events occurred during the week. But what significance do they have if the pair spent the whole week on a "swing" and were in a flat? Central bank meetings, nonfarm, unemployment, and ISM indices – none allowed the US currency to start growing, nor did they allow the European currency to continue growing. It turns out that there was no particular point to all these events. The European currency is overbought on all charts, but we do not see a correction. Therefore, everything now depends on market sentiment. If it continues to be "bullish," then we will not see any decline, even if the Fed raises the rate by 1% tomorrow. If the market does not sell, there will be no downward movement. Therefore, macroeconomic and fundamental backgrounds currently have a very low degree of influence on the movement of the EUR/USD pair.
Trading plan for the week of May 8–12:
- On the 24-hour timeframe, the pair continues to be above the Ichimoku indicator lines, but we cannot conclude that the uptrend will continue for a long time. The pair's decline is more likely, but no clear sell signals exist. There are only signals of strong overbought. Therefore, it is now possible to trade on the rise, but it should be understood that the European currency may collapse at any moment. The market situation could be clearer.
- As for selling the euro/dollar pair on the 24-hour TF, this can be considered no earlier than the price consolidates below the critical line. We expect the correction to be at 50% of the entire upward trend, i.e., in the area of the 1.0300 level. The ECB has already lowered the tightening pace to a minimum, which means the end of the rate hike cycle is nearing. This is the main reason market participants maintained high demand for the euro currency.
Explanations for the illustrations:
Support and resistance price levels, Fibonacci levels - levels that serve as targets when opening purchases or sales. Take Profit levels can be placed around them.
Ichimoku indicators (standard settings), Bollinger Bands (standard settings), MACD (5, 34, 5).
Indicator 1 on COT charts - the size of the net position for each category of traders.
Indicator 2 on COT charts - the size of the net position for the "non-commercial" group.
Trading analysis offered by RobotFX and Flex EA.
Source


Please do not spam; comments and reviews are verified prior to publishing.