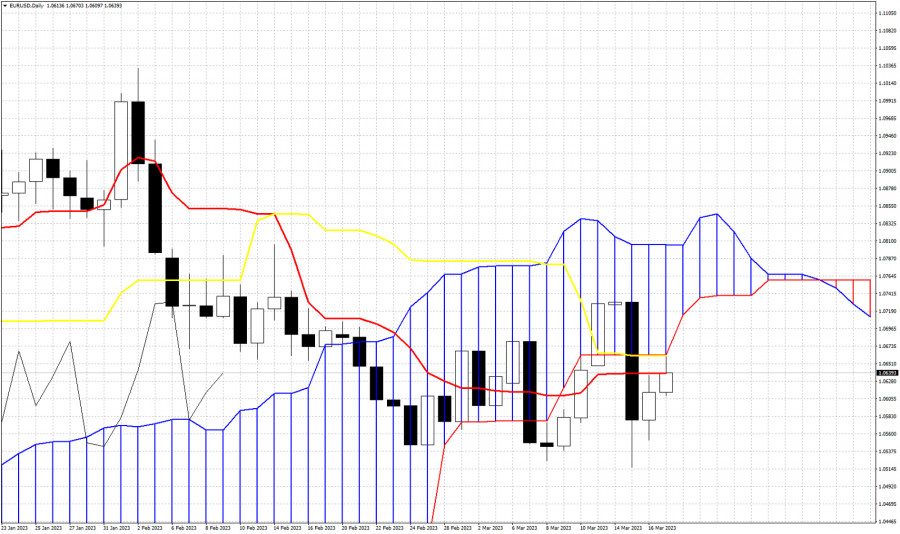
EURUSD is trading around 1.0645 as price is bouncing off the recent lows at 1.0517. Price remains in bearish trend according to the Ichimoku cloud indicator in the Daily chart as price is still below the Kumo (cloud). EURUSD is testing the lower cloud boundary and the tenkan-sen (red line indicator) and the kijun-sen (yellow line indicator). These two indicators provide resistance at 1.0638 and 1.0661 respectively. The lower cloud boundary is also found at 1.0661. Bulls need to recapture at least 1.0661 in order to hope for a bigger move higher. The Chikou span (black line indicator) is still below the candlestick pattern, but has bounced off cloud support. Support is at 1.0575 and bulls need to defend this level in order to hope for a move higher. Failure to hold above 1.0575 will bring more selling pressures.
Trading analysis offered by Flex EA.
Source


Please do not spam; comments and reviews are verified prior to publishing.