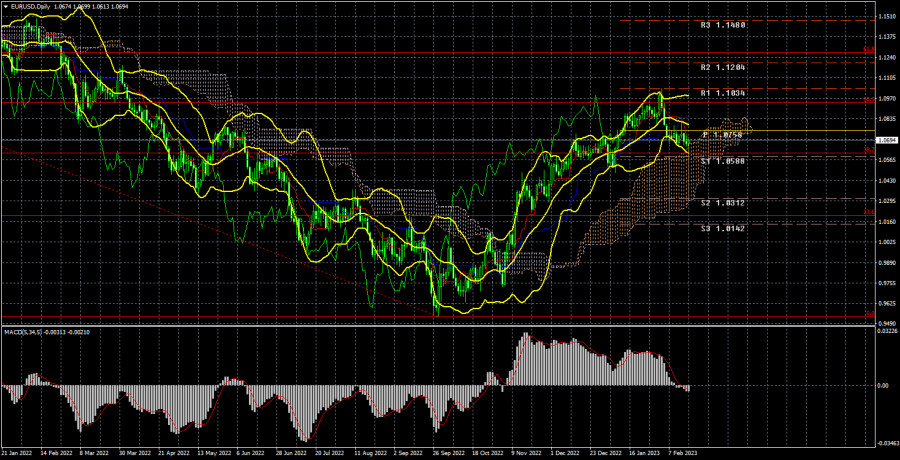
Long-term outlook.

The EUR/USD currency pair has continued to decline this week, but at a slower pace than previously. This week's macroeconomic events were few, thus neither the dollar nor the euro experienced significant support. Of course, the US consumer price index, which showed that the rate of price inflation dropped to 6.4%, was the most important data of the week. Yet the actual decline compared to the previous month turned out to be relatively slight, and the report as a result was well received. Since inflation has been slowing for seven months in a row and has recently started to slow further, traders were at a loss as to how to interpret this data, which might lead to a harsher tightening of the Fed's monetary policy in 2023. As a result, how the market interpreted this report was critical. The US dollar increased a little bit further at the end of the week, despite its interpretation not being quite clear. But purchases of American currency still predominate.
Technically speaking, the position is now more obvious. The crucial Kijun-sen line, which permitted the pair to continue falling for some time, can now be overcome with confidence. The downward movement may come to an end next week as the Senkou Span B line and the 1.0609 level are already close. We anticipate that these two supports will hold since we think the downward correction within the 24-hour TF should be stronger. Yet it should be kept in mind that in recent months, traders have only bought euros. Also, the ECB has started to tone down its language as well, not just the Fed. Even though it is still hard to declare that the next two meetings will see a rate hike of more than 0.75%, it can already be expected that these will not be the final rate increases. As a result, the European currency may see more than one period of rise in 2023, but for the time being, we must wait for the correction to continue.
COT evaluation.
Due to a technical issue, COT reports have not been made available since January 24; therefore, we can only evaluate reports made available before that day. They perfectly match market developments for the euro currency during the past few months. The aforementioned image makes it very evident that from the start of September, the net position of significant players (the second indicator) has been improving. At about the same time, the value of the euro started to increase. Although the net position of non-commercial traders is currently "bullish" and growing virtually weekly, it is the relatively high value of the "net position" that now permits the upward trend's impending end. The first indicator, which frequently occurs before the trend's end and shows that the red and green lines are very far apart from one another, signals this. The number of buy contracts from the "non-commercial" group increased by 9.5 thousand during the most recent reporting week, while the number of short positions decreased by 2,000. The net position consequently increased by 7.5 thousand contracts. For non-commercial traders, there are currently 134 thousand more buy contracts than sell contracts. Nonetheless, the correction has been developing for a while, so it is obvious even without news that the pair should keep falling.
Analysis of important events.
A fairly significant data on the fourth-quarter European GDP was also made public this week. As this was already the second assessment, the market did not respond particularly to it. Trade was even less interested in industrial output, and neither Philip Lane nor Luis de Guindos' speeches had any significant information. The only significant event of the week was the inflation data, which was followed by a "mini-storm" in the market. The inflation data, which will already be released in the European Union, will once again be the most significant event of the coming week, so we should prepare for another "mini-storm" then. At this time, inflation indicators are crucial because they will be used by central banks to determine whether to tighten monetary policy more aggressively. The dynamics of the euro/dollar movement can be significantly impacted by indications of new, additional tightening even though all anticipated planned rate hikes have already been taken into consideration.
Weekly trading strategy for February 20–24:
1) The pair has consolidated below the Kijun-sen line in the 24-hour time frame, raising doubts about the upward trend rather than canceling it out. Long positions are not yet significant; the correction might last for a while. Growth may restart with targets of 1.1034 and 1.1270 if the key line is reversely overcome. Next week, though, is not expected to see this.
2) The sales of the euro/dollar pair are still significant. The first target is unclear. The downward movement might continue to the fourth level, where the Senkou Span B line also runs, or it might stop at the 38.2% Fibonacci level, which is 1.0609. The euro currency, therefore, can decline but must surpass the level of 1.0609. It is possible to sell the pair cautiously.
Explanations for the illustrations:
Fibonacci levels, which serve as targets for the beginning of purchases or sales, and price levels of support and resistance (resistance/support). Take Profit levels may be positioned close by.
Bollinger Bands, MACD, and Ichimoku indicators (standard settings) (5, 34, 5).
The net position size of each trading category is represented by indicator 1 on the COT charts.
The net position size for the "Non-commercial" category is shown by indicator 2 on the COT charts.
Trading analysis offered by Flex EA.
Source


Please do not spam; comments and reviews are verified prior to publishing.