GBP/USD
Brief analysis:
The direction of the trend of the British pound sterling since February last year has been set by a downward wave. Quotes have reached the upper limit of the powerful support of the weekly scale of the chart. The wave structure does not look complete. The last section counts down from August 10. In the structure of this wave, the middle part (B) has been forming all last week.
Forecast for the week:
At the beginning of this week, the general flat mood of the movement is expected to continue with a downward vector. The decline is likely up to the support boundaries. By the end of the week, the probability of a reversal and the beginning of a price rise increases, up to resistance levels.
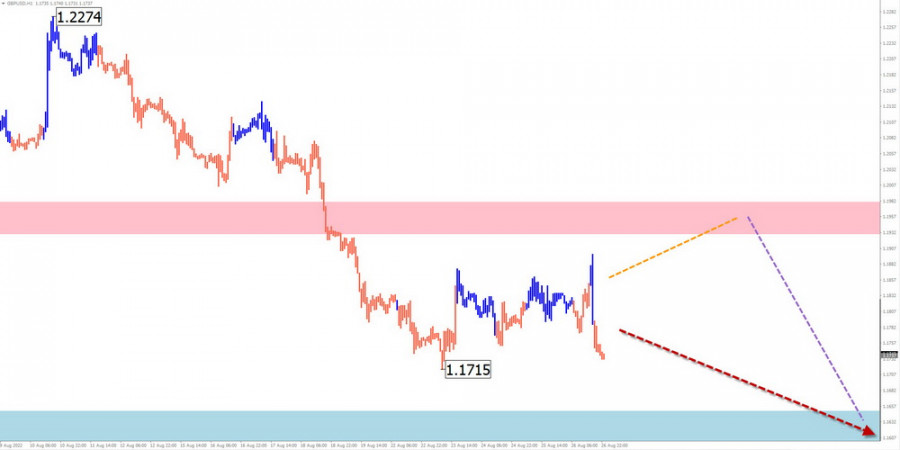
Potential reversal zones
Resistance:
- 1.1940/1.1990
Support:
- 1.1650/1.1600
Recommendations
Sales: possible in fractional lots within the intraday. The potential is limited by the support zone.
Purchases: will become possible after the appearance of confirmed reversal signals in the area of the support zone.
AUD/USD
Brief analysis:
The unfinished section of the dominant bearish trend of the Australian dollar started on April 5. By now, the first two parts (A-B) have been fully formed in the wave structure. Since August 11, the unfinished section of this wave has been counting down. Quotes support the level of intermediate resistance.
Forecast for the week:
In the next couple of days, we can expect a sideways course of movement along the borders of the resistance zone. Closer to the weekend, the probability of a change of course and a resumption of price reduction increases. Support levels show the lower limit of the expected weekly move.
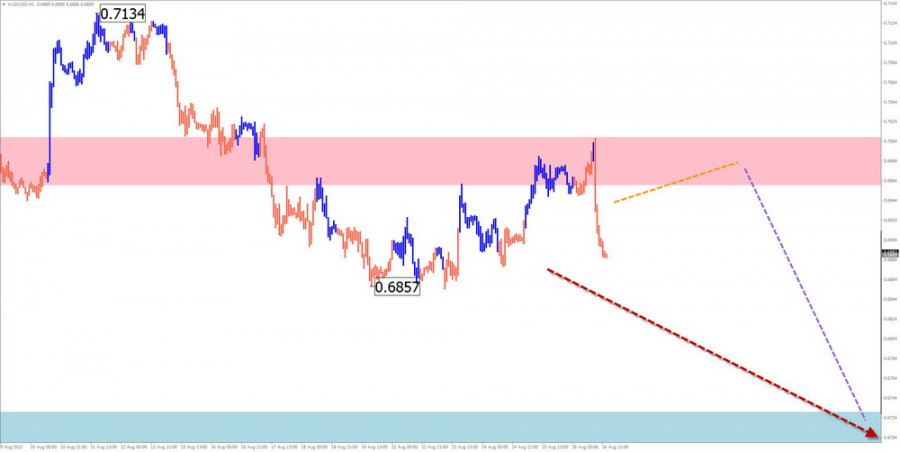
Potential reversal zones
Resistance:
- 0.6960/0.7010
Support:
- 0.6730/0.6680
Recommendations
Purchases: high-risk and not recommended.
Sales: will become relevant after the appearance of reversal signals confirmed by your vehicle in the area of the resistance zone.
USD/CHF
Brief analysis:
The upward trend continues on the weekly scale of the Swiss franc chart. Since mid-May, the price has been forming a corrective wave. Its structure now looks complete. The ascending section of the chart from August 9 has a reversal potential and, if confirmed, will become a new wave at the dominant rate.
Forecast for the week:
In the coming week, the price is expected to move in the corridor between the nearest zones in the opposite direction. A downward vector is likely in the next couple of days. The second half of the week is expected to be more bullish, with the pair's rate rising to the resistance limits.
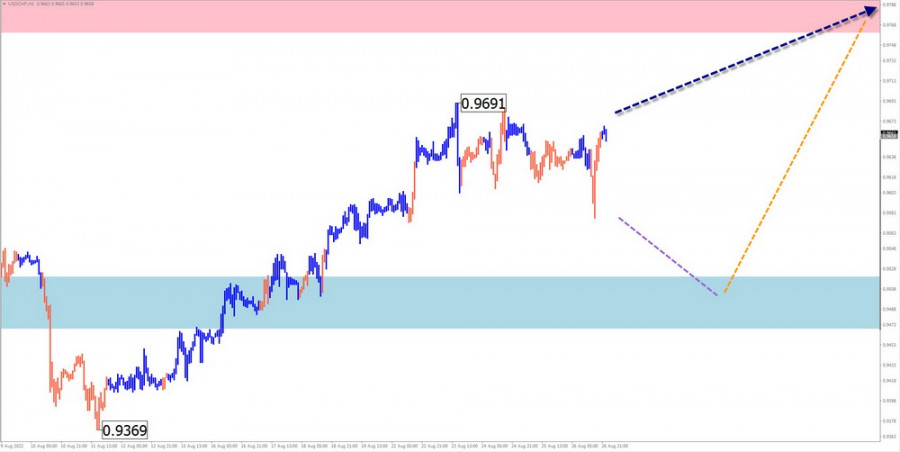
Potential reversal zones
Resistance:
- 0.9760/0.9810
Support:
- 0.9520/0.9470
Recommendations
Sales: possible within the framework of individual sessions.
Purchases: will become possible after the appearance of confirmed signals at the end of the upcoming decline.
EUR/JPY
Brief analysis:
The euro/yen cross has been steadily moving to the "north" of the price chart over the past two years. The current wave for today has been reporting since June 8. This correction of the main trend has the form of a "descending flag" figure and is not completed at the time of analysis. Quotes move along with strong resistance.
Forecast for the week:
In the coming days, the completion of the lateral mood of the movement is expected. In the area of the resistance zone, then you can wait for a reversal and the beginning of a decline in the exchange rate. The support zone shows the lower limit of the expected weekly course of the pair.
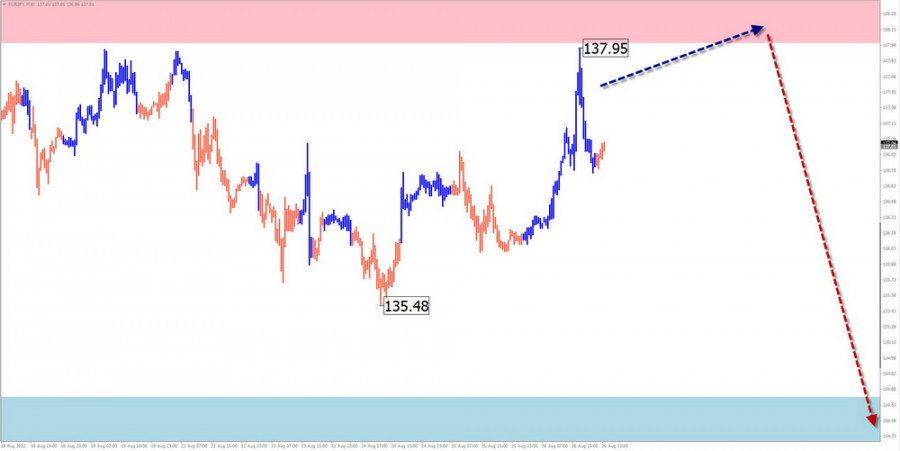
Potential reversal zones
Resistance:
- 0.9760/0.9810
Support:
- 0.9520/0.9470
Recommendations
Sales: possible within the framework of individual sessions.
Purchases: will become possible after the appearance of confirmed signals at the end of the upcoming decline.EUR/JPY
Brief analysis:
The euro/yen cross has been steadily moving to the "north" of the price chart over the past two years. The current wave for today has been reporting since June 8. This correction of the main trend has the form of a "descending flag" figure and is not completed at the time of analysis. Quotes move along with strong resistance.Forecast for the week:
In the coming days, the completion of the lateral mood of the movement is expected. In the area of the resistance zone, then you can wait for a reversal and the beginning of a decline in the exchange rate. The support zone shows the lower limit of the expected weekly course of the pair.
Potential reversal zones
Resistance:
- 138.00/138.50
Support:
- 134.60/134.10
Recommendations
Purchases: have little potential and can be risky. It is recommended to reduce the lot as much as possible.
Sales: will become relevant after the appearance of confirmed reversal signals in the area of the resistance zone.
USDollar Index
Brief analysis:
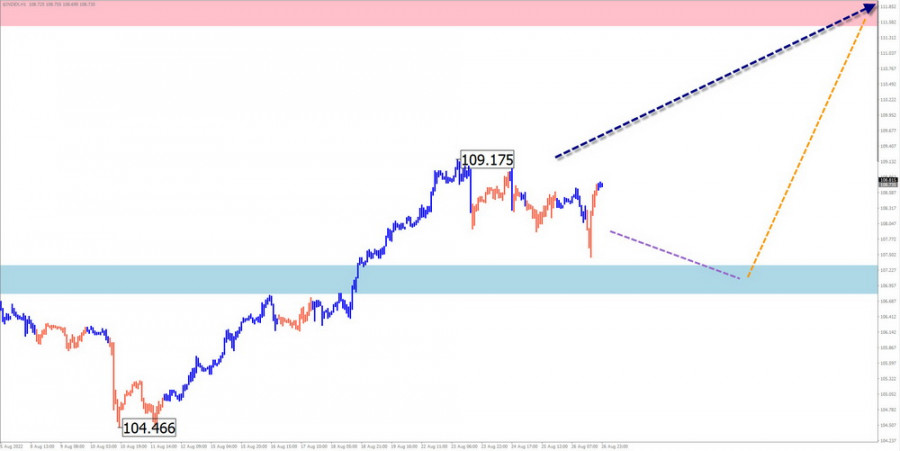
The positions of the US dollar relative to national currencies continue their march to new heights. Quotes have pushed through a powerful resistance zone, which has become support. The unfinished wave has been reported since August 10. In its structure, the middle part (B) is nearing completion.
Forecast for the week:
The end of the period of decline of the US dollar is expected in the next couple of days. Then you can wait for a reversal and a resumption of the growth rate. The resistance zone is the upper limit of the probable range of the move.
Potential reversal zones
Resistance:
Resistance:
- 111.50/112.00
Support:
- 107.30/106.80
Recommendations
Purchases: purchases of national currencies in anticipation of the weakening of the dollar can lead to losses of the deposit and are not recommended.
Sales: transactions for the weakening of national currencies will become possible after the appearance of confirmed signals of your used trading systems.
#Ethereum
Brief analysis:
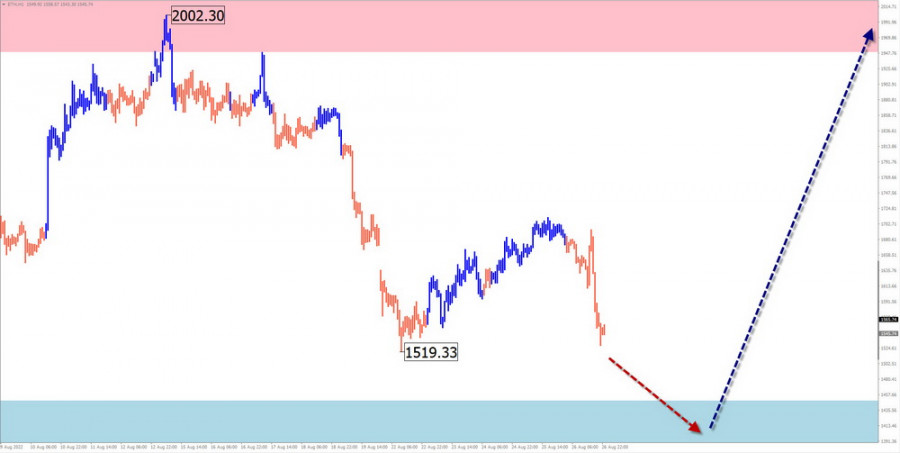
The period of weakening of Ethereum's positions is in the past. Since mid-June, the altcoin price has been moving up. The potential of this movement does not exceed the correction level yet. In the structure of the wave, the middle part (B) is nearing completion. There are no signals of an imminent change of direction on the chart.
Forecast for the week:
In the coming days, the general downward movement vector is expected to continue until the decline is fully completed in the area of calculated support. Closer to the weekend, we can expect an increase in volatility, a change of direction, and a resumption of the growth of the ether rate.
Potential reversal zones
Resistance:
- 1950.0/2000.0
Support:
- 1450.0/1400.0
Recommendations
Sales: have low potential and a high degree of risk. Such transactions can lead to losses.
Purchases: will become possible after the appearance of reversal signals confirmed by your vehicle in the area of the support zone.
Explanations: In simplified wave analysis (UVA), all waves consist of 3 parts (A-B-C). At each TF, the last incomplete wave is analyzed. The dotted line shows the expected movements.
Attention: the wave algorithm does not consider the duration of the movements of the instruments in time!
Trading analysis offered by Flex EA.
Source


Please do not spam; comments and reviews are verified prior to publishing.