EUR/USD
Brief analysis:
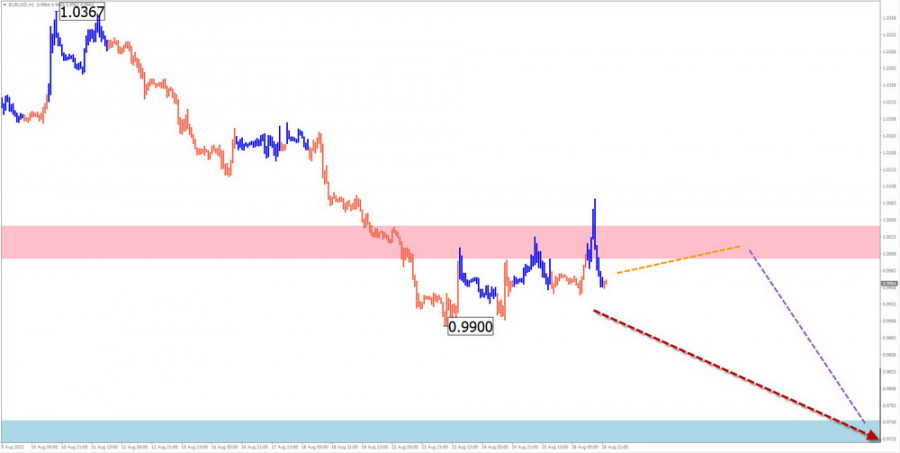
The dominant trend of the euro has brought the quotes of the main pair to parity with the US currency. The price pushed through the strong support level, turning it into resistance. The next section of the trend is counting down from August 10. The flat section that started a week ago forms an intermediate correction. After its completion, the decline will continue.
Forecast for the week:
At the beginning of the week, the continuation of the "sideways" along the resistance zone is likely. In the second half, you can expect activation, reversal, and resumption of the downward movement of the price. The support zone is the lower limit of the probable weekly range of the move.
Potential reversal zones
Resistance: - 1.0000/1.0050
Support: - 0.9760/0.9710
Recommendations
Purchases: Not recommended.
Sales: will become possible after the appearance of confirmed reversal signals in the area of the resistance zone.
USD/JPY
Brief analysis:
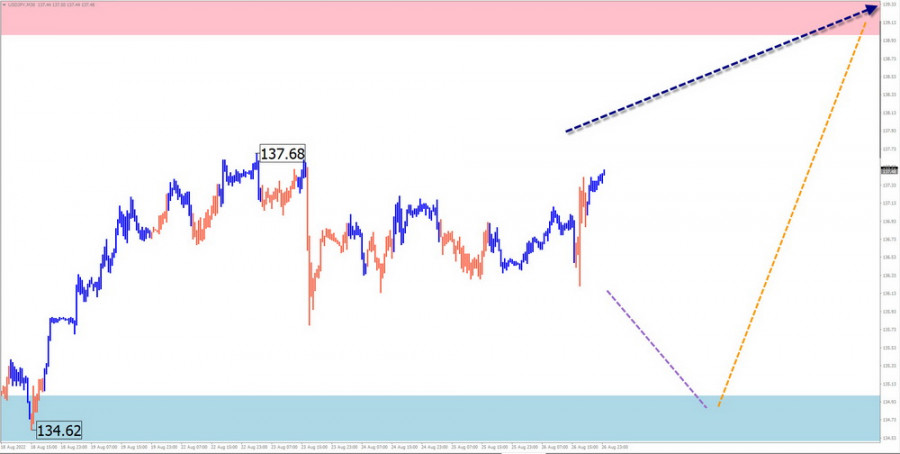
The upward trend that began in March 2020 brought the quotes of the major pair of the Japanese yen to the area of strong resistance. Over the past two months, a correction has been formed as a stretched plane. On August 2, a new wave of the main course started. The middle part of the wave has been developing in the structure recently.
Forecast for the week:
At the beginning of the week, a continuation of the lateral mood is more likely. A descending vector is not excluded. The decline can be expected no further than the settlement support. By the end of the week, we can count on the resumption of the upward course and the price growth to the resistance zone.
Potential reversal zones
Resistance: - 139.00/139.50
Support: - 135.00/134.50
Recommendations
Sales: may be possible only within the framework of individual trading sessions with a fractional lot.
Purchases: recommended after the appearance of confirmed signals in the area of the support zone.
GBP/JPY
Brief analysis:
The direction of movement of the pound/yen cross has been setting the uptrend of the instrument for more than two years. Since April of this year, the price on the chart has been forming a flat correction from the lower border of the powerful resistance zone, most of all resembling the "horizontal pennant" figure. This structure is close to completion and is in the final phase of formation.
Forecast for the week:
The price will likely continue moving horizontally along the support zone levels in the next couple of days. Closer to the weekend, the probability of a reversal and a resumption of the growth rate increases. With a change of direction, volatility is sure to increase dramatically. A short-term puncture of the lower border of the support zone is not excluded.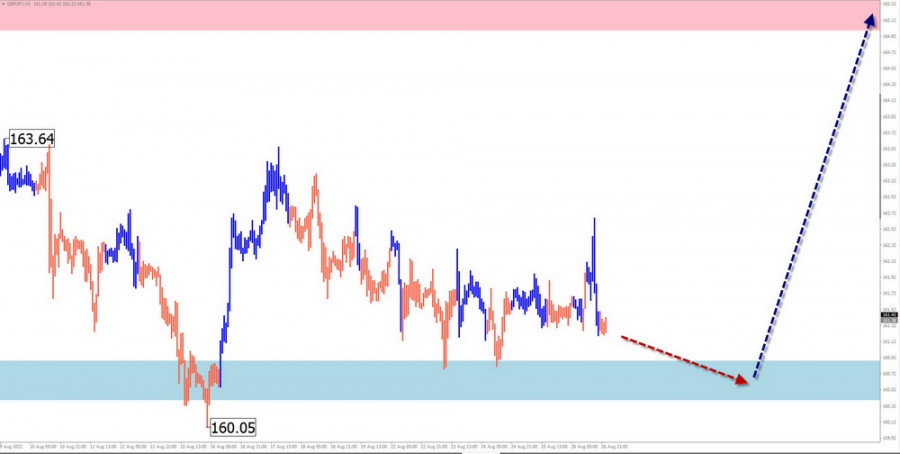
Potential reversal zones
Resistance: - 165.00/165.50
Support: - 160.90/160.40
Recommendations
Sales: Not recommended.
Purchases: the appearance of reversal signals confirmed by your vehicle in the area of the support zone will become relevant.
USD/CAD
Brief analysis:
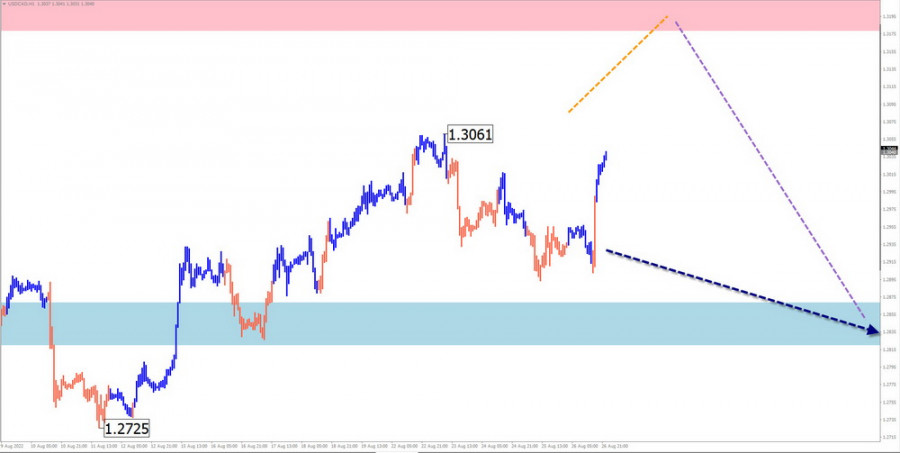
Quotes of the Canadian dollar continue the upward trend that began in June last year. The unfinished site for today counts down from June 7. In the last month and a half, the price has been forming a complex correction in the horizontal plane, which has not yet been completed.
Forecast for the week:
Price fluctuations of the instrument are expected in the range between the nearest counter zones. In the first half, there are more chances of continuing the price movement in the horizontal plane. A short-term decline in the support area is possible. The growth of quotes is more likely by the end of the weekly period.
Potential reversal zones
Resistance:
- 1.3180/1.3230
Support:
- 1.2870/1.2820
Recommendations
Sales: possible, but carry a high degree of risk. It is desirable to reduce the trading lot.
Purchases: will become preferred after the appearance of confirmed signals in the area of the support zone.
NZD/USD
Brief analysis:
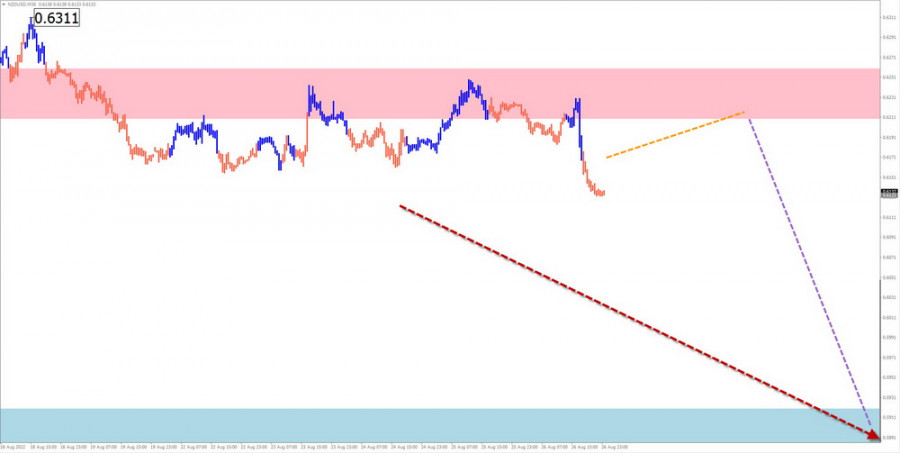
The major of the New Zealand dollar continues its downward movement, which started in February last year. The unfinished section of the main course has been reported since August 12. The wave develops according to the impulse type. A week ago, the quotes pushed through fairly strong support. After fixing the price under it, the road for further reduction of quotations will be open.
Forecast for the week:
At the beginning of the week, a sideways flat may continue. A short-term growth to the resistance zone is not excluded. Next, we should wait for the formation of a reversal and a change of course. The scope of the probable weekly range shows the calculated support.
Potential reversal zones
Resistance: - 0.6210/0.6260
Support: - 0.5920/0.5870
Recommendations
Purchases: risky and not recommended.
Sales: will become relevant after the appearance of suitable signals of your trading systems in the area of the resistance zone.
GOLD
Brief analysis:
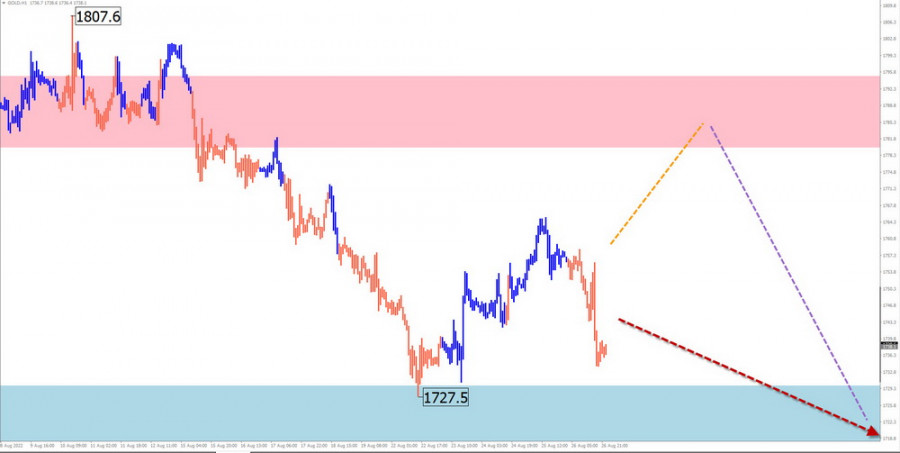
A bearish wave has set the direction of the gold trend since March of this year. From the powerful support, the instrument's price has been forming a corrective wave since mid-July. At the moment, its structure is not complete. In it, the middle part (B) is nearing the end.
Forecast for the week:
Pressure on the support zone is possible in the coming days. A short-term puncture of the lower border is not excluded. Then you can wait for a reversal and a resumption of the growth rate. The calculated resistance demonstrates the upper limit of the weekly course.
Potential reversal zones
Resistance: - 1780.0/1795.0
Support: - 1730.0/1715.0
Recommendations
Sales: have little potential and are not recommended.
Purchases: suitable conditions for transactions will appear after the appearance of reversal signals in the area of the support zone.
Explanations: In simplified wave analysis (UVA), all waves consist of 3 parts (A-B-C). At each TF, the last incomplete wave is analyzed. The dotted line shows the expected movements.
Attention: the wave algorithm does not consider the duration of the movements of the instruments in time!
Trading analysis offered by Flex EA.
Source


Please do not spam; comments and reviews are verified prior to publishing.