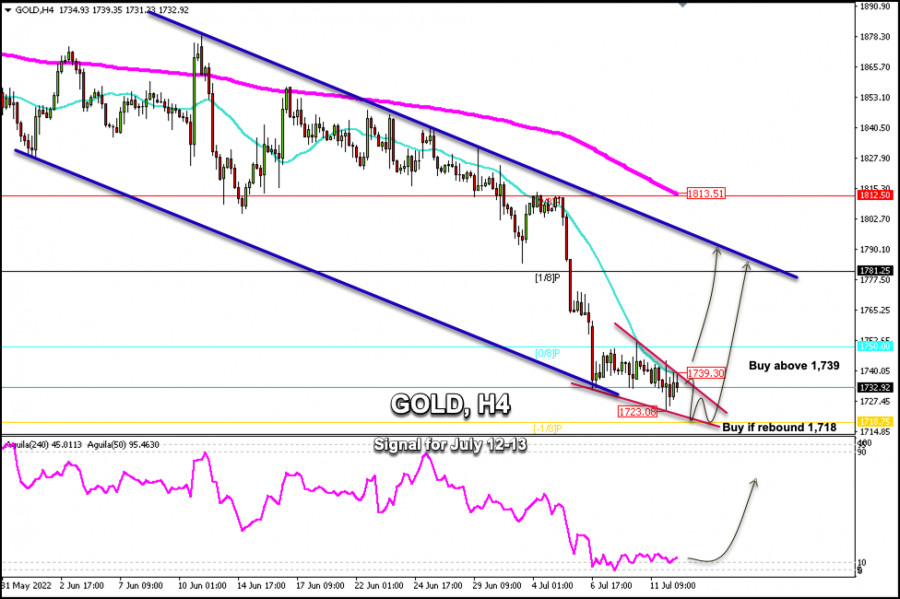
Gold (XAU/USD) has been trading inside a downtrend channel since the beginning of June. The price is in the zone of lows that was last seen in September 2021. In the Asian session, gold fell to 1,723 and then rebounded.
The decline in Treasury bond yields could be a factor that limits the fall in gold and, in turn, could support the recovery. The dollar index is also pulling back from its highs and is likely to encourage a gold rally.
On the 4-hour chart, we can see the formation of a symmetrical triangle pattern. Gold is likely to continue oscillating within this pattern in the coming hours. In case of a sharp break above the SMA 21 (1,739), it would confirm the bullish signal.
The next support is seen at 1,718.75 where -1/8 Murray is located. Below it, the metal could reach the psychological level of 1,700 and then the 2021 low at 1,675. On the upside, the first resistance is seen at 1,740 (21 SMA) and above follows 1,750 (0/8 Murray). Just after overcoming 1,813 (200 EMA), the short-term bearish outlook would change and gold would start a new bullish sequence.
As long as gold trades within the symmetrical triangle pattern and below the 21 SMA, the asset will remain under strong bearish pressure. Above 1,740, we could have a buying opportunity with targets at 1,750 and 1,781. The eagle indicator is overbought and a strong technical bounce is likely in the coming days.
Trading analysis offered by RobotFX and Flex EA.
Source


Please do not spam; comments and reviews are verified prior to publishing.