Outlook BTC/USD (Bitcoin) :
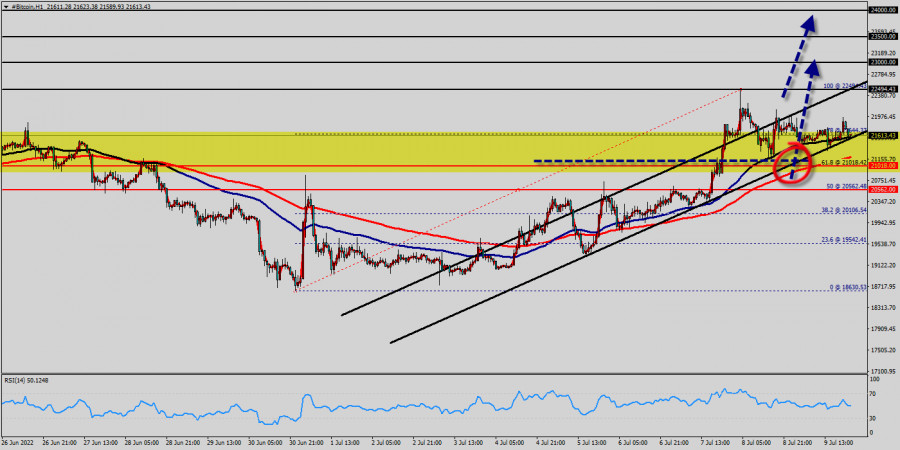
Bitcoin has been forming a major support and lower highs during the past few days, which can be witnessed by the following mid-term ascending trend line from the level of $20,018 (golden ration, 61.8% of Fibonacci retracement levels).
The trend line has rejected the price twice (marked by red circle) and initiated a new bullish leg. The price has to break above the trend line to then aim for the long-term descending channel's upper boundary, marked yellow square.
Bitcoin has risen from their recent lows, signaling an increase in volatility in the near term from the prices of $18, $19k, $20k and $21,018.
Today, it should be noticed that 1 BTC equals $21,600 (down -206.4 | -0.94%). Yesterday, the BTC/USD reached the top at $22,494, then the trend rebounded from the price of $22,494 to close at $21,600.
Bitcoin (BTC) rallied to the 100-week moving average on July 9, a level that could act as a battleground between the bulls and the bears. Several analysts are watching this level because a break and close above it could be the first sign that the bear market may be ending on the hourly chart.
However, the near-term outlook remains bullish for the greenback from the major area of $21k.
On the local time frame, Bitcoin (BTC) is trading between the support level at $21,018 formed by the false breakout and the resistance at $22,494. Daily range between the price of $22,494 and $21,018.
Therefore, at the moment the price is near the upper level, which means that one can expect the test of the $22,494 mark soon in order to re-reach the the double top again.
We should expect an attempt to develop a rise in the price of Bitcoin against the US Dollar and a test of the support area near the level of $21,018. Where can we expect a rebound up again and a continuation of the climb in the quotes of the BTC/USD.
Bitcoin stayed above the psychological level of $$21,018 over the weekend, indicating a lack of urgency to accumulate at the current levels. The bulls are attempting to extend BTC's rise above $21,018 in the week beginning 9 July 2022.
Technical market outlook : : 09/07/2022
Bitcoin price :
After finding bids reach to $21,018 , bitcoin price recovered above 21,018. Initial Bitcoin support lies near the21,018 level (61.8% of Fibonacci retracement levels). A decent breakout and follow-up move above 21,018 could open the gate for a push towards the $22,494 level. The main resistance remains near the zone of $22,494 - $23,000. Also it should be noted that Bitcoin and cryptocurrencies unite as the bears lose their momentum. The market is indicating a bullish opportunity above the above-mentioned support levels, for that the bullish outlook remains the same as long as the 100 EMA is headed to the upside.
Trading BTC/USD :
Uptrend scenario :
An uptrend will start as soon, as the market rises above resistance level $21,018, which will be followed by moving up to resistance level $22,494. Further close above the high end may cause a rally towards $23,000.
Trading analysis offered by RobotFX and Flex EA.
Source


Please do not spam; comments and reviews are verified prior to publishing.