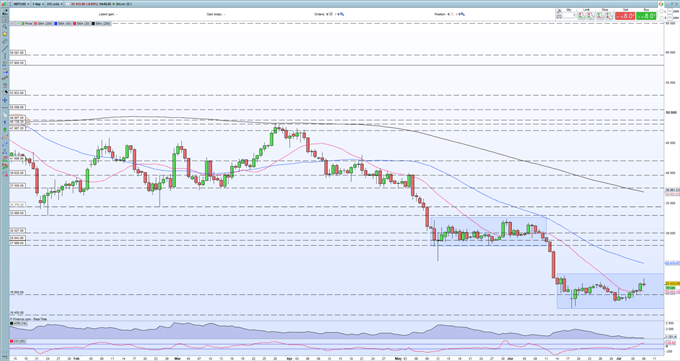
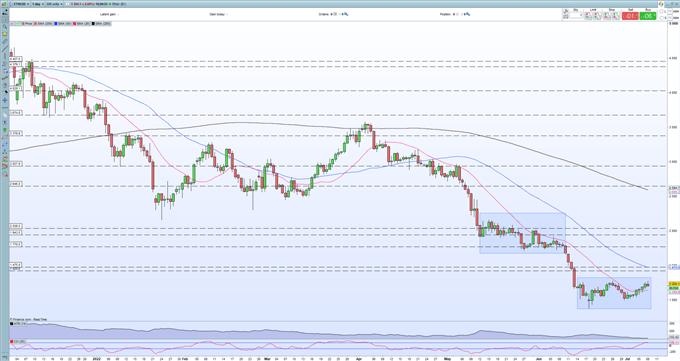
Another fairly quiet week in the cryptocurrency space with most coins trading in a well-defined short term range. Bitcoin has been trading either side of $20k for the last few weeks but made a run at $22.5k overnight before fading back. Price action will likely remain limited over the next weeks unless we get some new, macro drivers. Both charts are showing some positive short-term signs but remain in a longer-term, dominant, downtrend. Price action remains muted for now.
Looking at the Bitcoin chart, the current boxed-in price action is reminiscent of trade between early May and early June before BTC made a sharp leg lower. A break below $18.6k would expose the multi-month $17.6k low. One ray of light for Bitcoin bulls is the short-term pattern of higher lows and higher highs made over the last week. If this price action continues to grind higher, then a test, and break, of the recent high around $23.2k would make the chart outlook a little more positive.

How to Use Twitter for Traders
The Ethereum daily chart is pretty much a mirror image of Bitcoin over the last couple of months with two trading zones joined by a sharp sell-off. Again a series of higher lows and higher highs are visible over the last week. A break, and close, above $1.3k would help allow Ethereum to re-test the $1,700 area.

What is your view on Bitcoin – bullish or bearish?? You can let us know via the form at the end of this piece or you can contact the author via Twitter @nickcawley1.
Trading analysis offered by RobotFX and Flex EA.
Source


Please do not spam; comments and reviews are verified prior to publishing.