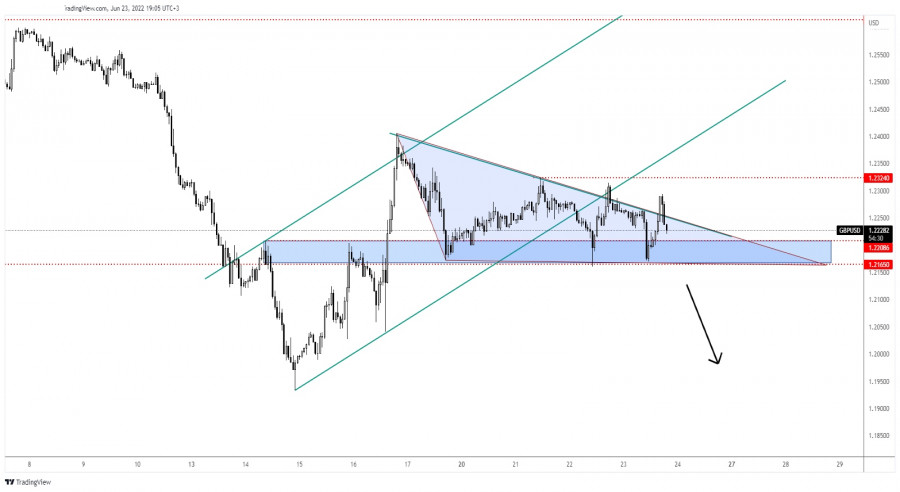
The GBP/USD pair is trading in the red at 1.2232 at the time of writing. In the short term, the pair moves sideways, so we'll have to wait for the pair to escape from this range before going long or short. The price seems undecided as the Dollar Index moved sideways in the short term.
The pair continues to stay in a neutral zone as the US data came in worse than expected earlier. The Flash Services PMI came in at 51.6 points versus 53.4 points in the previous reporting period, even if the specialists expected a potential growth up to 53.9 points. Furthermore, the Flash Manufacturing PMI was reported at 52.4 points below 56.0 estimated, while the Unemployment Claims dropped from 231K to 229K failing to reach the 227K forecasts. On the other hand, the UK inflation data came in mixed. The Flash Services PMI came in better than expected signaling further expansion, while the Flash Manufacturing PMI reported worse than expected data.
GBP/USD False Breakout!

The GBP/USD pair is trapped between the 1.2324 and 1.2165 levels. In the short term, the rate developed also a triangle pattern. As you can see on the H1 chart, the rate registered only false breakouts from this pattern.
In the short term, it could continue to move sideways. Technically, the false breakouts above the triangle's resistance may signal a downside breakout and a deeper drop. Still, we need strong confirmation before taking action.
GBP/USD Forecast!
Staying below the triangle's resistance and making a valid breakdown below the 1.2165 could open the door for a larger downside movement. A new lower low, a bearish closure below this static support could bring new selling opportunities.
Trading analysis offered by RobotFX and Flex EA.
Source


Please do not spam; comments and reviews are verified prior to publishing.