Key data on the growth of the US labor market as a whole did not disappoint. Almost all components of the release came out either at the forecast level, or slightly better than forecasts. Such an "even" result enabled the EUR/USD bears to gather their strength and organize a small counterattack to the base of the 7th figure. By and large, the May Nonfarm Payrolls report helped prevent the planned assault on the resistance level of 1.0760 (the lower limit of the Kumo cloud on the daily chart). But, perhaps, this was the only "achievement" of the report. The bears did not have enough weighty arguments to return to the area of the 6th figure. All previous attempts that were made this week ended in failure. However, EUR/USD bulls also showed indecisiveness – despite the relatively favorable fundamental background, they could not even approach the main price barrier of 1.0800. The bulls of the pair overcame the resistance level of 1.0760 twice, but then the upward momentum gradually faded. The release thwarted another attempt.

It can be assumed that the EUR/USD bulls will make another, already the third one, in order to still get closer to the 8th figure. The May Nonfarm can be interpreted in different ways – both in favor and against the US currency. It all depends on how the accents will be placed. The report is rather ambiguous, so the market may well shade or vice versa – highlight positive or negative aspects.
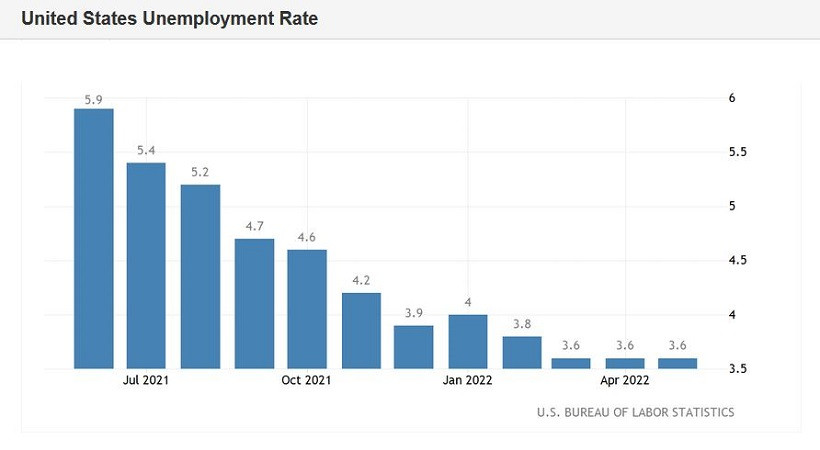
For example, the main indicator – the unemployment rate – was in the red zone. However, it is necessary to take into account the fact that this component of the release was disappointing only by the fact that it was released at the previous month's level, that is, at 3.6% (instead of the projected decline to 3.5%). On the one hand, the forecast was not justified, but on the other hand, the de facto unemployment rate is currently in the region of 27-month lows. The last time the indicator was at 3.6% was in February 2020 (that is, before the coronavirus crisis), and before that – 53 years ago, back in 1969. Therefore, it is impossible to talk about any "negative trends" here. For the second month in a row, experts expect the indicator to decrease to 3.5%, and for the second consecutive month, the indicator remains at the same level of 3.6%.
There is another component of the report that raises certain questions. We are talking about salaries. The average hourly wage increased by 5.2% in May (year-on-year). On the one hand, this is quite a good result. On the other hand, the growth rate of this indicator is slowing down for the second consecutive month. Such trends do not play in favor of the US currency, amid continuing high inflation in the US.
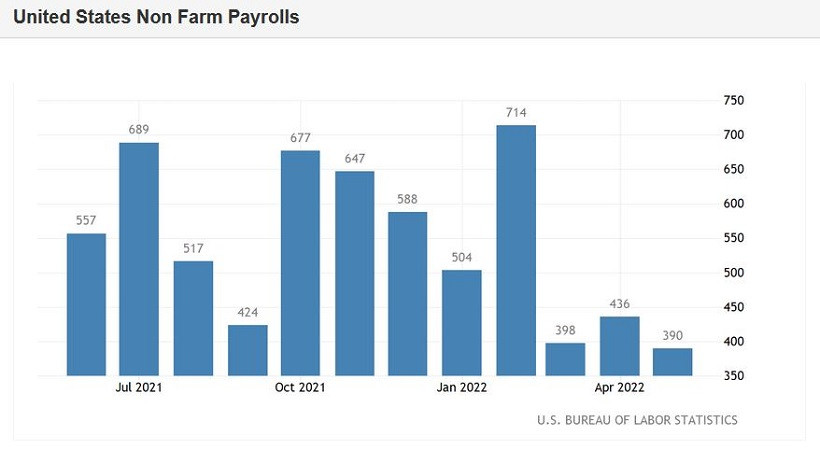
The number of people employed in the non-agricultural sector increased by 390,000 in May (the indicator came out at around 428,000 in April), while experts expected to see this indicator slightly lower, at around 325,000. During the last half of the year, this component has fluctuated in the range of 250-680,000 (only in February it shot up to 750,000). That is, in general, this indicator also did not disappoint, and even exceeded the forecast estimates. But the indicator of the increase in the number of people employed in the manufacturing sector disappointed, being in the red zone – instead of the projected growth of 40,000, it increased by only 18,000. In the private sector of the economy, experts expected to see an increase of 325,000 jobs, while the indicator increased by 333,000.


Thus, the release, with all its pros and cons, did not help either the bears or the bulls of the euro-dollar pair. Bears could not go below 1.0700, while bulls did not overcome the resistance level of 1.0760 (not to mention the conquest of the 8th figure). Traders were in no hurry to open large positions amid such a "faceless" release, either towards the downside or towards the upside – especially ahead of the weekend.
Other fundamental factors also failed to swing the pendulum in one direction on Friday. For example, the oil market turned out to be on the greenback's side, which is showing growth again, despite the fact that OPEC+ members agreed to increase oil production by 648,000 barrels per day (in July and August). At the same time, the ISM business activity index played against the dollar on Friday, which fell immediately to 55.9 points in May, contrary to forecasts of a decline to 56.4 points. The indicator has been declining for the second consecutive month.
Summarizing the above, we can conclude that despite the Nonfarm, the pair remained "trapped" in a 100-point flat. Throughout the week, bulls and bears of EUR/USD have been trying to leave the area of the 7th figure in order to either resume the downward trend or develop further corrective growth, with the mandatory overcoming of the 1.0800 mark. But the contradictory fundamental background did not allow the parties to escape from this "trap".
In conditions of such uncertainty, it is most expedient to take a wait-and-see attitude. Short positions will be prioritized when the bears settle under the 1.0700 mark, that is, within the 6th figure. In this case, a further descent to the support level of 1.0610 is likely (the average line of the Bollinger Bands on the daily chart). It is advisable to consider longs only after overcoming the 1.0800 mark and consolidating in the area of the 8th figure. While the pair is "hanging out" within the 7th figure, it is best not to rush to open trading orders.
Trading analysis offered by RobotFX and Flex EA.
Source


Please do not spam; comments and reviews are verified prior to publishing.