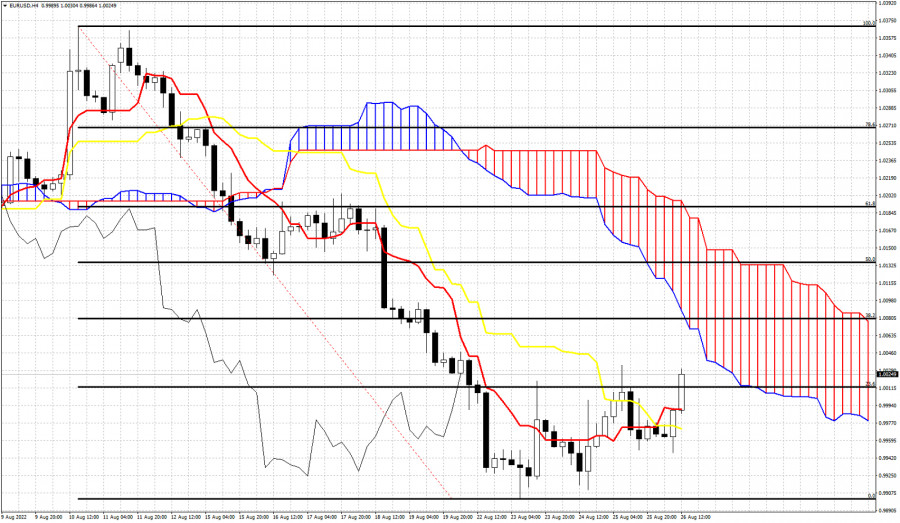
Black lines- Fibonacci retracements
EURUSD is trading above recent highs of 1.0010. Price is now at 1.0030 with a 4 hour candle close above the recent highs and above both the tenkan-sen (red line indicator) and the kijun-sen (yellow line indicator). Support by the two indicators is at 0.9992 and 0.9970. Price remains below the Kumo (cloud) which is the main bearish characteristic of the chart. The Chikou span (black line indicator) is still below the candlestick pattern trying to break above resistance at 1.0030-1.0050. As long as price is below the Kumo, trend will remain bearish according to the indicator. There are some signs that could be the start of a bounce or trend reversal, but it is too early to tell. Upside bounce target for EURUSD is the lower cloud boundary and 50% retracement at 1.0070-1.0080.
Trading analysis offered by Flex EA.
Source


Please do not spam; comments and reviews are verified prior to publishing.